The problem is the graph
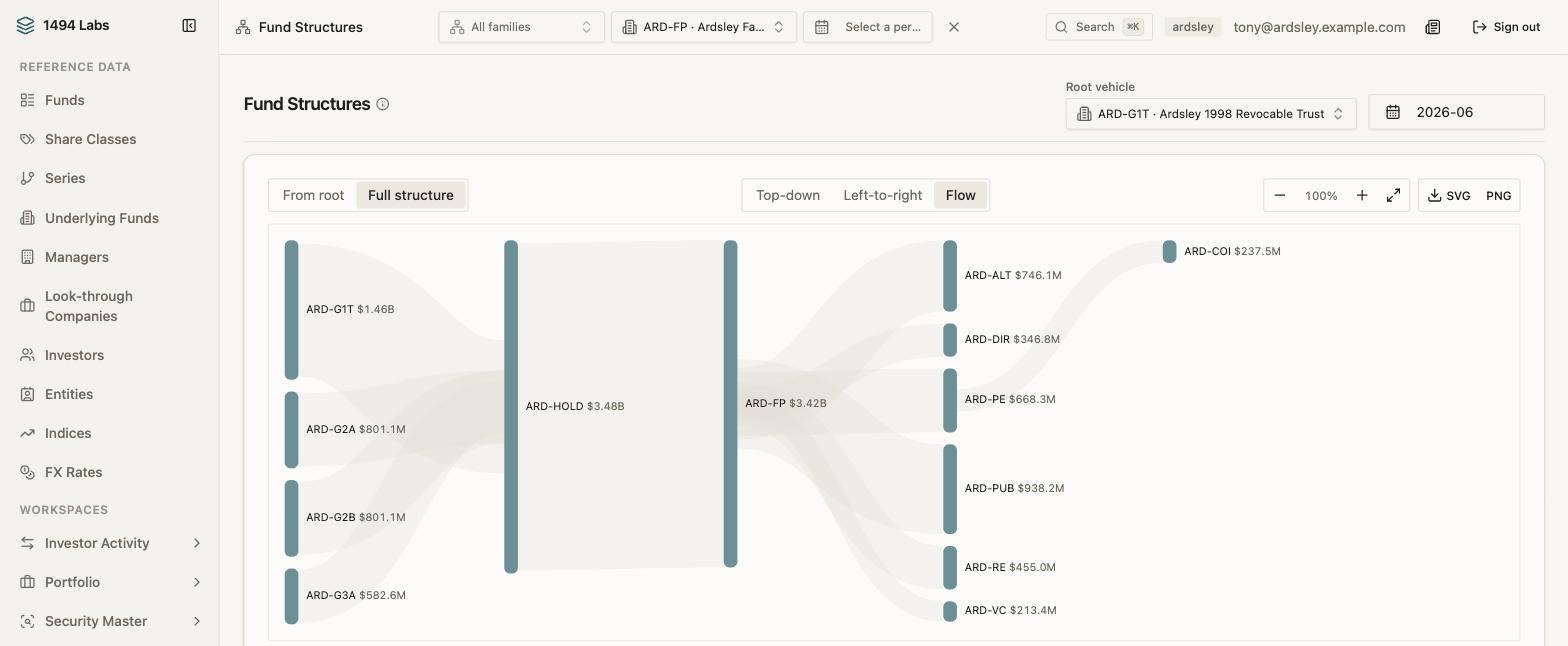
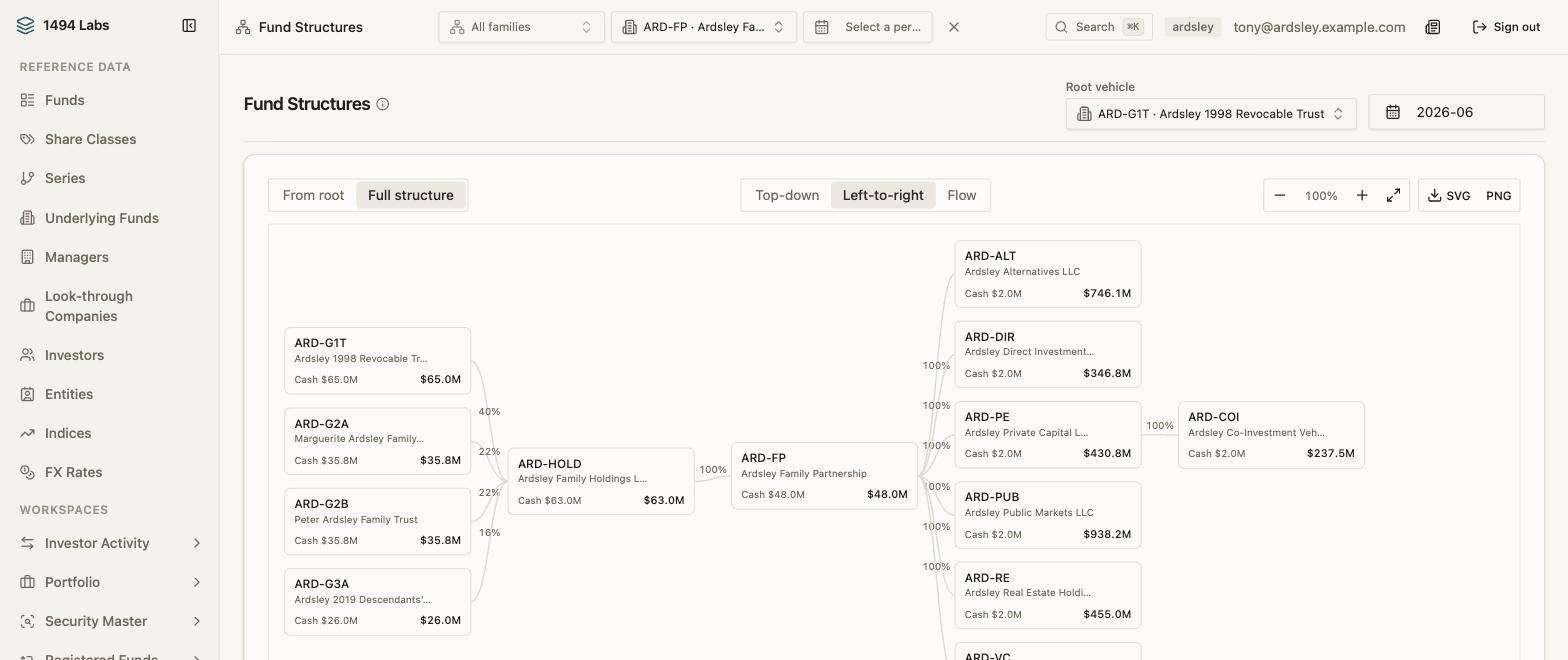
Ask a single family office what it is worth and the honest answer involves a diagram. There is a revocable trust from 1998, two more for the second generation and one for the third. They own a holding company between them. The holding company owns a family partnership. The partnership owns an alternatives vehicle, a private capital vehicle, a venture vehicle, a real estate vehicle, a public markets vehicle and a directs vehicle, and one of those owns a co-investment vehicle underneath it.
Every one of those is a real legal entity with its own book. The number the family wants is what all of it comes to, from where they sit, without counting the same underlying asset twice on its way up.
- ✓Ownership derived from capital accounts, never asserted alongside them
- ✓Intercompany interests eliminated, so nothing is counted twice
- ✓Legal and consolidated views of the same structure
- ✓Trusts, GRATs, partnerships, holding companies and asset SPVs on one platform
- ✓Real assets and digital assets on the same ledger as the funds
Ownership is derived, not typed
The usual failure here is a spreadsheet of ownership percentages maintained beside the accounting. It is correct on the day it is written and wrong the first time somebody contributes capital, because the percentage and the capital account are two records of one fact and only one of them gets updated.
1494 Labs derives the ownership edges from the capital accounts themselves, per period. If a trust contributes to the holding company, its share moves because its capital moved. The structure diagram and the net worth statement are two readings of the same underlying record, so there is no version of events where the picture disagrees with the number.
What the elimination is for
A holding company's balance sheet shows an interest in the partnership beneath it. The partnership's shows its own investments. Add the two together and the partnership's assets appear twice, once directly and once wrapped inside the holding company's interest.
The consolidated view removes those internal interests explicitly and shows you the removal rather than hiding it. On a structure like the one above, more than a billion dollars of intercompany interest is eliminated between the legal totals and the consolidated one. That column is the whole reason the consolidated number can be trusted.
The structure, from any angle
The same graph draws as a top-down org chart, a left-to-right chart, or a value-weighted flow. From one vehicle downward, when the question is what this trust owns; or the entire structure at once, when the question is what the family owns. A structure with several tops cannot be drawn from any one of them, which is exactly why the whole-structure view exists.
Beyond the marketable book
Family offices hold things funds do not. Real property, art, aircraft and other tangible assets carry measurement and appraisal histories. Digital assets carry custody locations. Both post to the same ledger as the fund interests and the public equity, under the same rules and with the same audit trail, which is what makes a single consolidated statement possible at all.
Related reading
- The platform overview
- ABOR and IBOR, and why most systems keep them apart
- Private equity fund accounting · for the commitments underneath
Currently in private development
Built for the people who have to sign the books rather than only read them. If this is your problem, we would like to hear how you have it.